Geospatial Map of Lobby Funders
A Python project for mapping organizations and funding relationships geographically.
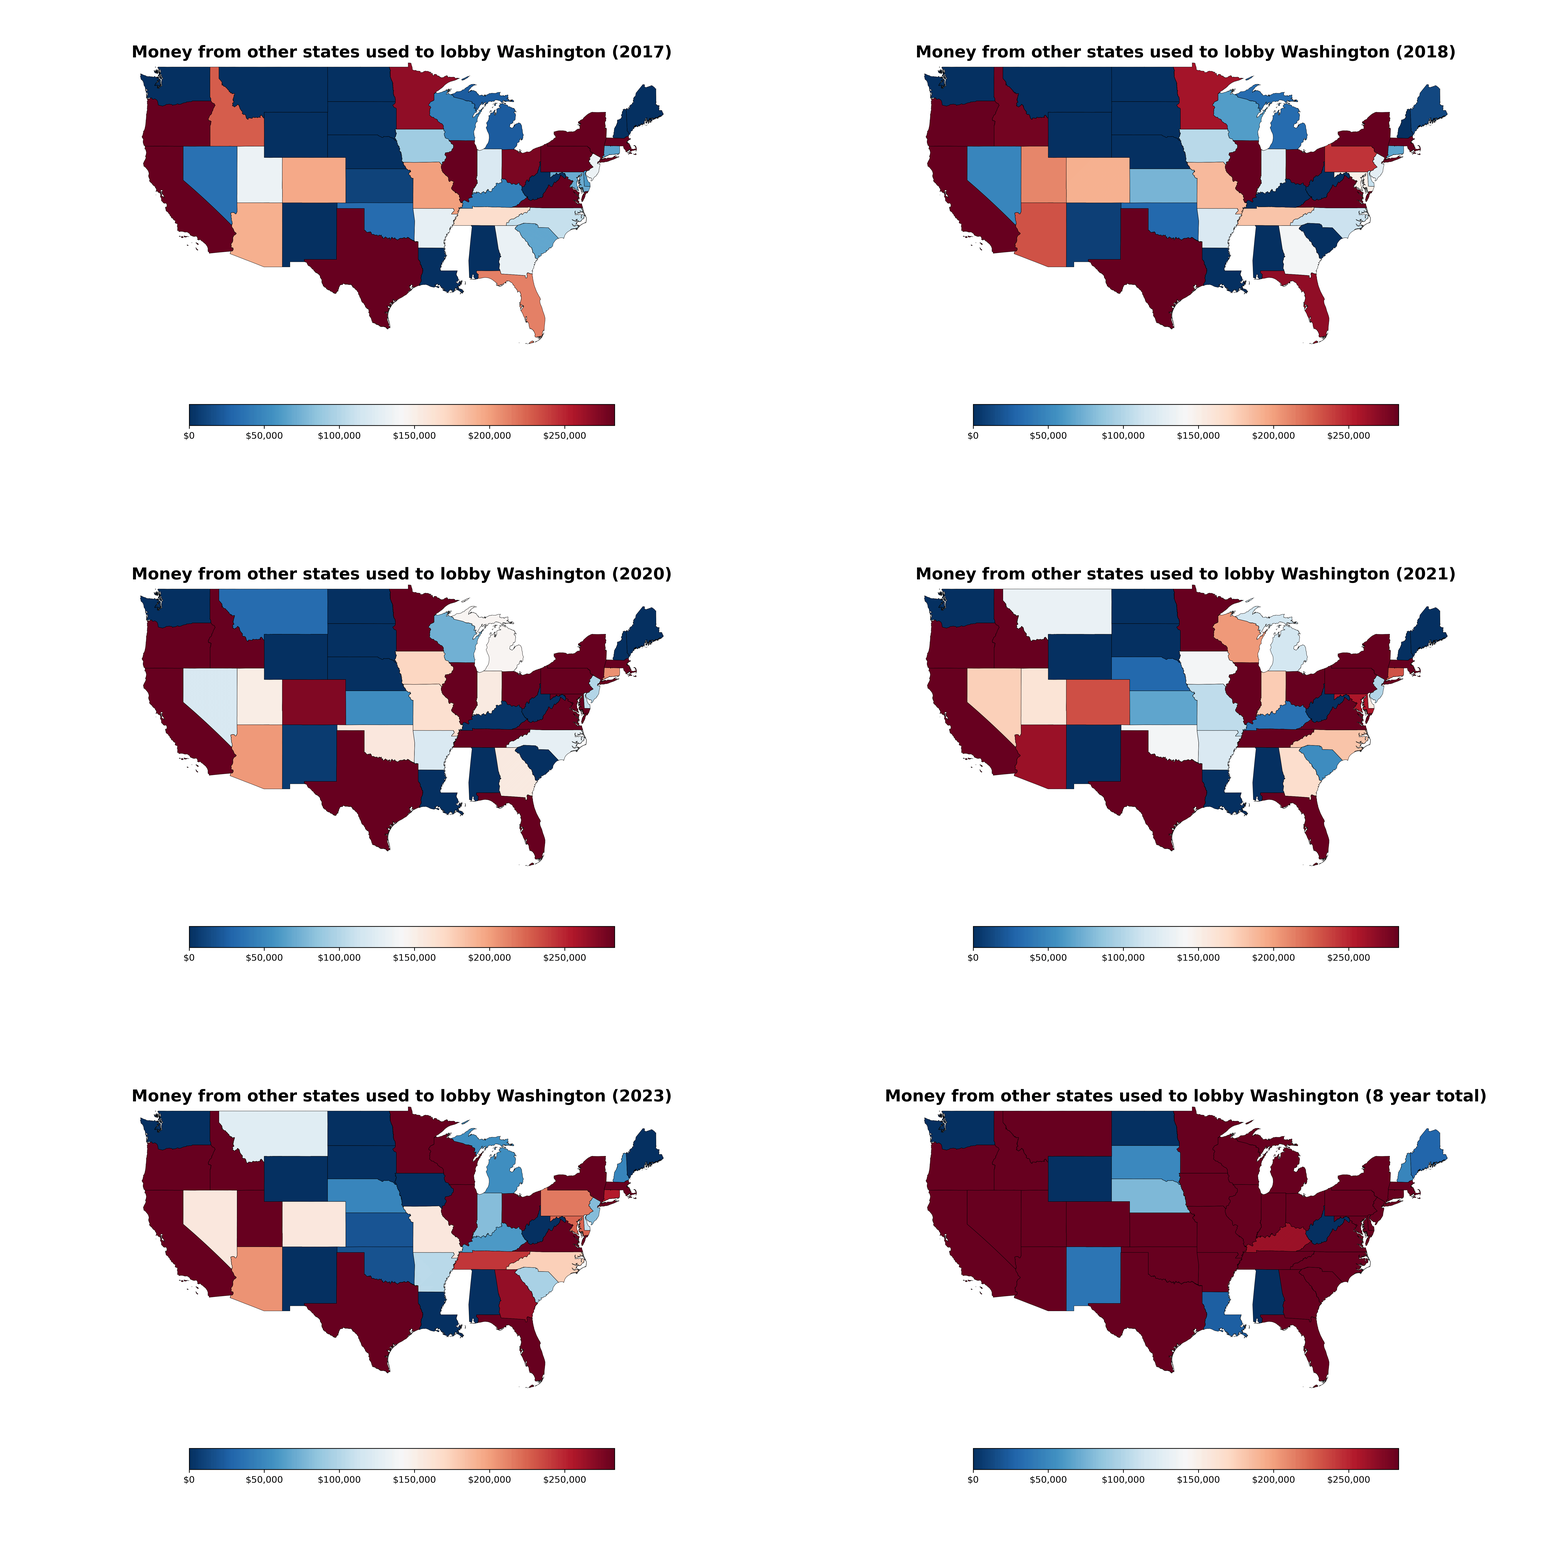
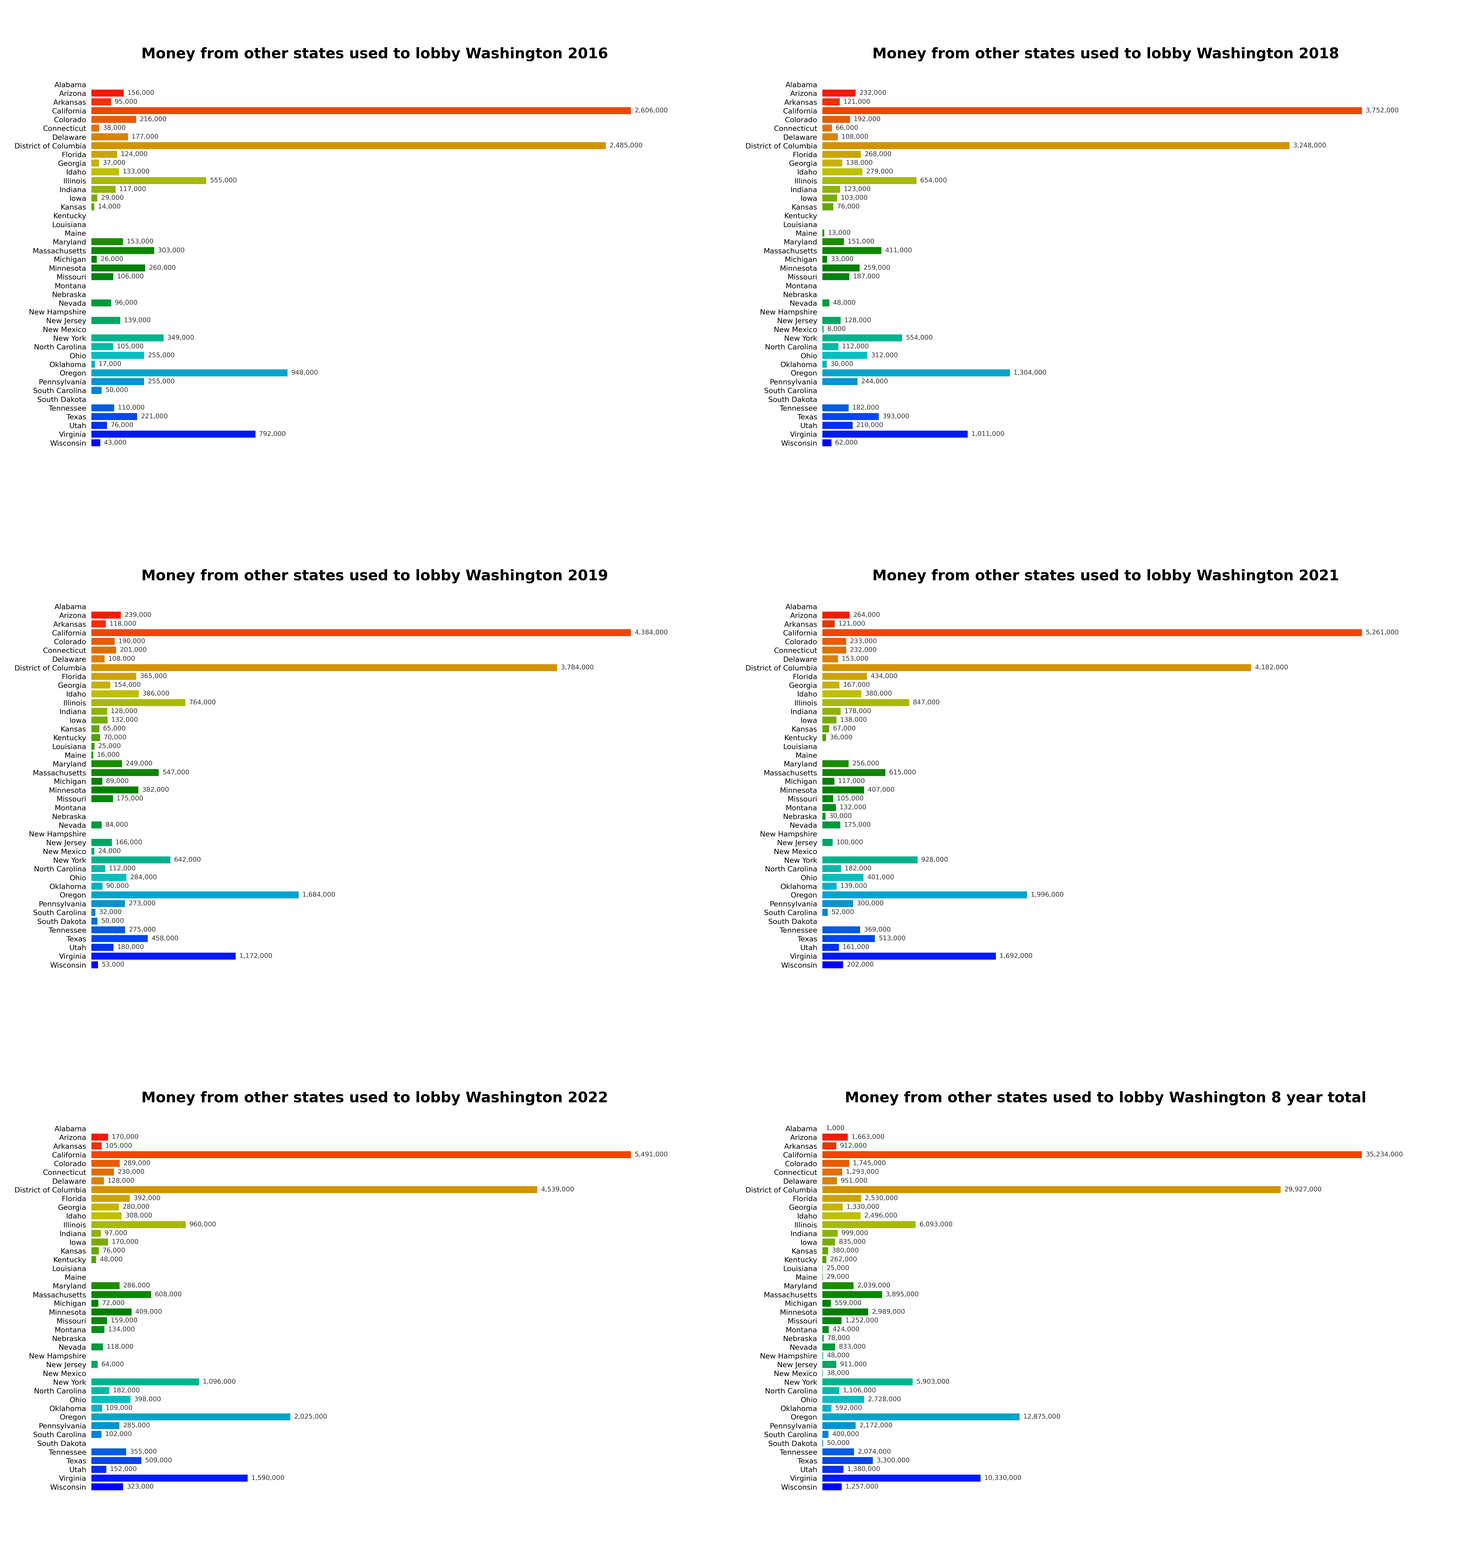
Charting lobby money in WA from outside state
From the 2016 through 2023
- License: GPL-3.0-or-later
Repo contents:
❯ lsd --tree --sort extension
.
├── us_states # shape file
├── recordings # required for build output
├── tools
│ ├── optimizer_for_states.py
│ └── plot_color_gradients.py
├── Dockerfile
├── states_no_wa.csv
├── README.md
├── geospatial_map.py # mapped numbers animation
├── bar_chart.py # bar chart animation
├── test_setup.py
├── docker-entrypoint.sh
├── container_enter.sh # interactive shell
├── container_run.sh # run command for docker
├── requirements.txt
└── LICENSE.txt # gpl ftw
Inspiration:
I was looking through data.wa.gov for a dataset to do a project with, and I saw that the PDC has information from lobbyist disclosures on who is funding their lobbying efforts. I thought that was really interesting, so I looked into it more, and one of the things that really struck me was from how much of the money is coming from outside of WA.
I plan to release more charts done with other information from this dataset. I have a blog site with a couple more charts at developer monkey / unixgreybeard.org.
TL;DR how do I run these chart generators?
The easiest thing to do is run the chart recorders in a docker image, so dependencies are isolated from your system and the recordings return in both .gif and .mp4 format in the $(pwd)/recordings folder.
OCI version is available at Docker Hub and requires a recordings folder for output.
A geospatial exploration of lobby funders. The project profile is loaded from MDX and can be expanded later with the repository README, screenshots, or implementation notes.
This profile includes a short excerpt from the repository README.